
What is it for?
“Xdebug is an extension for PHP to assist with debugging and development.”
The quote above is from the official website, which in other words says that XDebug helps reduce the number of bugs and ease the process of finding them. It achieves that by running as a PHP extension, which needs to be configured, but gets lots of information regarding the running process and all its data, which is crucial in confusing debugging scenarios.
How does it improve my workflow?
No more echo-ing the variables, and guessing values. With XDebug you have everything laid out in front of you, and in case of PHPStorm with a comfortable search functionality and neat visuals to speed up even the dreaded and completely undesired moments of bug-finding.
PHPStorm
What is it?
It is an integrated development environment. It contains all the necessary tooling, highlighting, syntax check and indexing functionality needed for a hassle-free development process.
How does it make me more productive
Using an IDE, everything is preconfigured to just work as is out of the box. Although there is a rich collection of plugins available in the internal marketplace, you really don’t need that many to be quick after a fresh install. Most of the shortcuts just make sense and it’s very keyboard friendly.
Mac with Homebrew
brew cask install phpstormUbuntu with Snap
sudo snap install phpstorm --classicWindows with Chocolatey
choco install phpstormEnvironment
Vagrant
This guide is focused on getting it working on Vagrant, although the configuration is universal as well for local development and docker containers. In the future it will be updated with the respective articles, but for now, the applied settings can be used there as well.
The Vagrant setup selected for this example, is the boilerplate, described in one of the previous posts. It already has XDebug installed and configured, so getting it to work in this case will be a breeze.
Befriending PHPStorm with XDebug
Server configuration
Finally, you might think, after introducing so much context, it is time to show how to make it work.
First things first, so you have to actually install XDebug service on the machine that you are using ( or the Virtual Machine ). That can be accomplished by running the following command in case of a Debian system.
sudo apt-get install -y php-xdebugFurther configuration is done within the php extension. The extension file for xdebug is located at: <php path>/mods-available/xdebug.ini. To find out where is your php installation, you can run a quick `php -i | grep php.ini`.
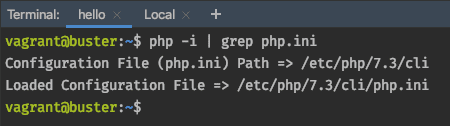
In this case the path is /etc/php/7.3. After we found out the path, the next step is to configure the module, sure thing! Let’s head on to xdebug.ini as noted above. To modify it, run the editor with sudo! There, you can set the following strings
1. zend_extension=xdebug.so # path to extention binary. Most of the time in path already.
2. xdebug.remote_enable=true # enable remote debugging, exactly what we need
3. xdebug.remote_connect_back=true
4. xdebug.remote_host="192.168.33.10" # remote host path, I'll explain that in a second
5. xdebug.idekey=PHPSTORM # connection key
6. xdebug.remote_port=9000 # connection port
7. xdebug.remote_autostart=on
8. xdebug.max_nesting_level=1000
To find out which remote_host is used, you can run ip a or ifconfig in case of a UNIX system. In case of Debian, the first option is the right one, so the following is acceptable
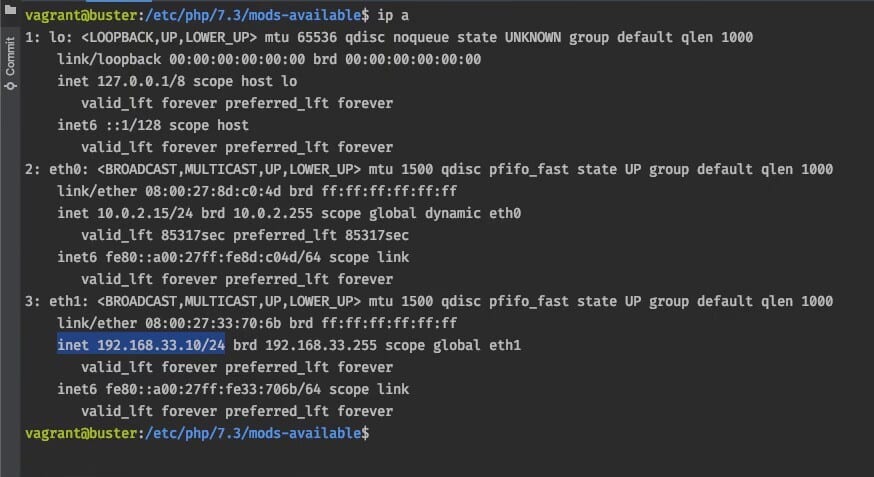
In this case the eth1 device is responsible for the connection with the host system of the virtual machine. In your case it might be different, but the idea stays the same. Once that’s configured, you can save the file, and restart php and apache. In order to achieve that, run
sudo service apache2 restartAnd in a short while, the changes will be applied.
Client configuration
On this step we are dealing with PHPStorm.
The first and foremost thing to do, is to access preferences. To do that quickly on Mac, just press CMD+,. Once in settings, search for Debug. It will return a tab containing everything we need for now.
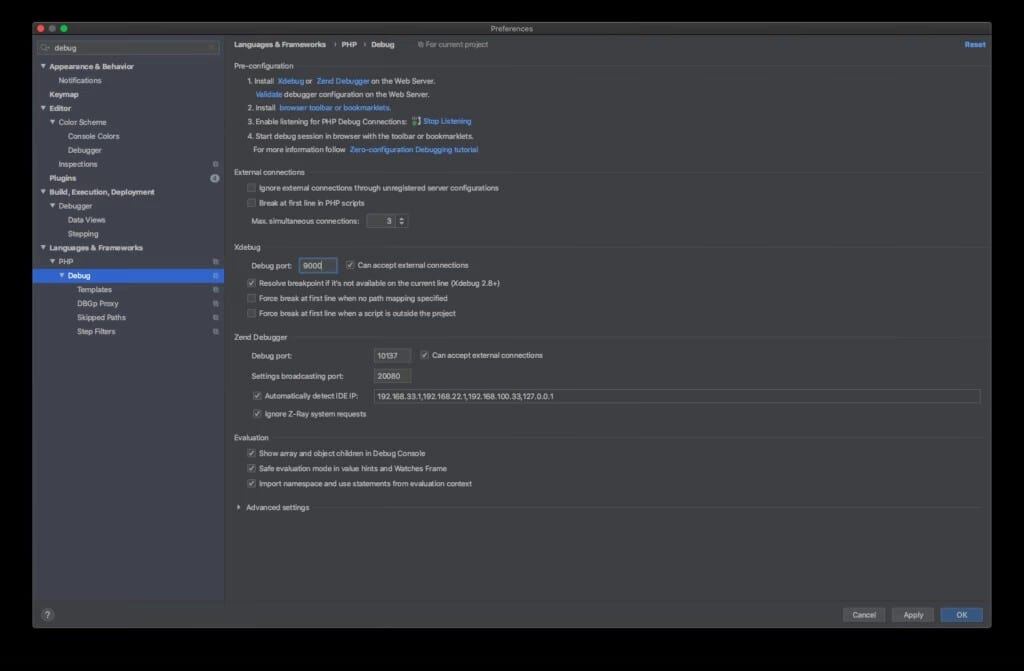
In most cases, the port and connection preferences defined by default would be the best fitting ones for your use case. To quickly check whether everything worked, below the “1. Install XDebug or Zend Debugger”, there is a button which states “Validate“. By clicking that, a new window will popup with a quick config for the test and a response from the server.
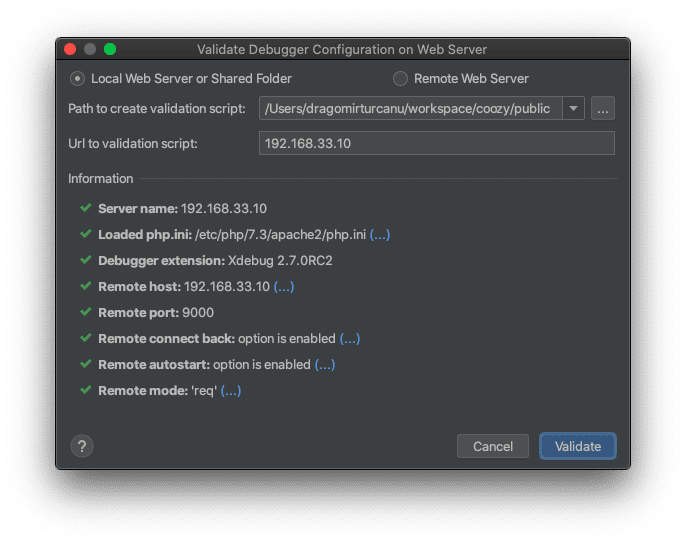
The path depends on the project, and in this particular example, I use a Laravel application, therefore the starting path for the project is where the index.php lives. In this particular example, it is located in the /public folder.
Sample Usage
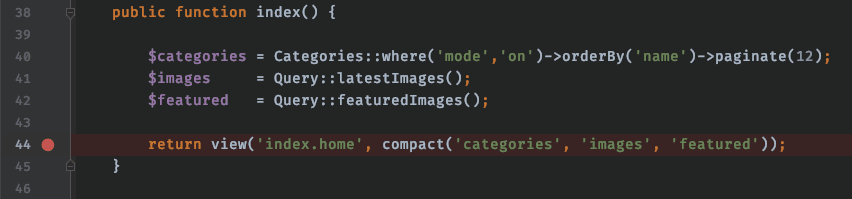
To smoke test these settings, let’s add a breakpoint to return statement of the homepage controller. It means that once we head to the homepage of the local website, the breakpoint will trigger, halt the application till further action, and show everything stored in the current session. Let’s try it:
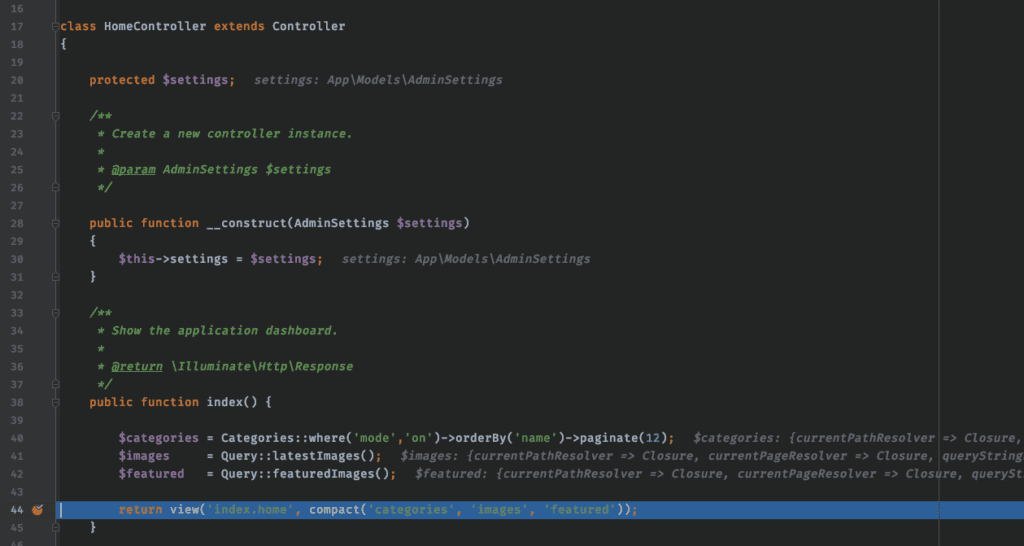
Once I finally refresh the page, the editor window changes by adding some notes regarding the types and structure of the used properties and variables, as well as highlight the current position in the execution.
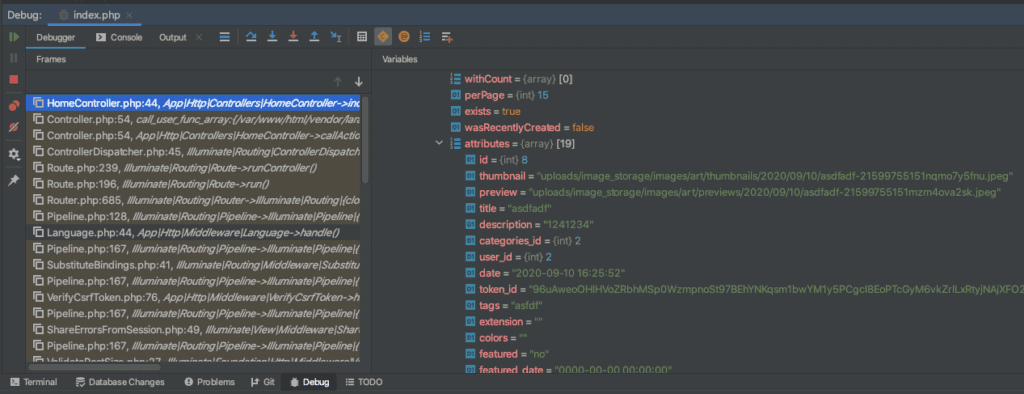
In the Debug window ( CMD+5 ), a neat looking table and variable trees are located, which are there to reveal crucial information regarding the current state of the application. The history of function calls, values of variables and console output.
Once we are done with reviewing the current frame, we can jump to the next breakpoint by hitting the green arrow, or by pressing CMD+ALT+R.
Conclusion
Just like that, after a few configuration steps you can enjoy an improved debugging experience using your favorite editor. Regarding what hidden features of XDebug within PHPStorm, those will be covered in another post in the near future. There is a lot to play with ;).
Thanks for reading!
Source: https://practicalphp.dev/configuring-xdebug-for-phpstorm/
Article created by Dragomir, Full-Stack Developer, Spense.